What is Weacodi?
Weacodi is an alternative way to visualize the weather forecast, allowing you to assess atmospheric conditions in one second. Instead of complex numerical values, Weacodi uses an intuitive diagram to quickly convey how comfortable or uncomfortable the weather will be. This unique approach allows you to understand at a glance whether you should, for example, plan a walk or a workout.
Weacodi introduces the Weather Comfort Diagram™: a visual language for understanding weather forecasts.
Weacodi is based on the principles of human cognitive perception of weather conditions and multimodality. This approach uses various sensory channels for a more complete and intuitive understanding of the weather.
You can dive deeper into the concept in the documentation section.
Weacodi displays various weather parameters, such as:
- Sky condition (sunny, cloudy)
- Precipitation (rain, snow)
- Comfort level (calculated based on weather conditions)
This allows you to quickly "feel" the weather without spending time analyzing complex data.
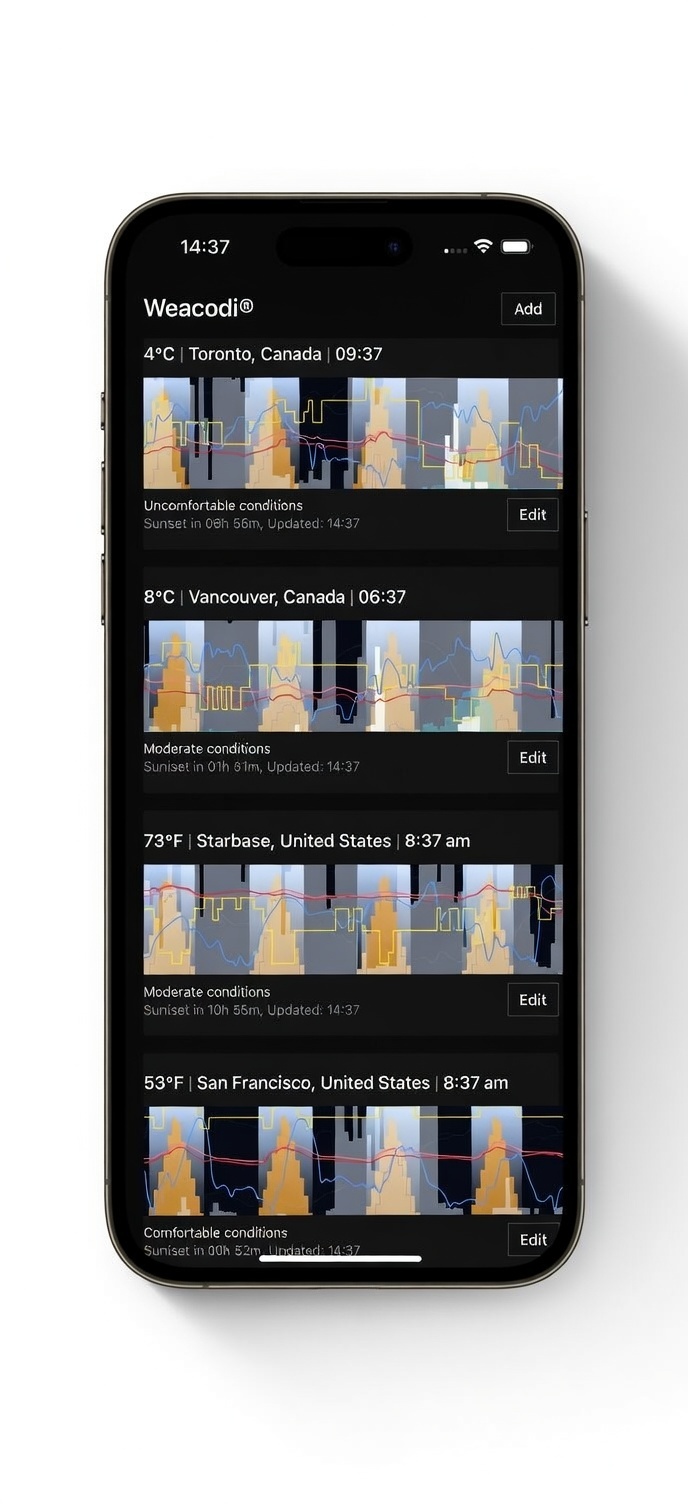
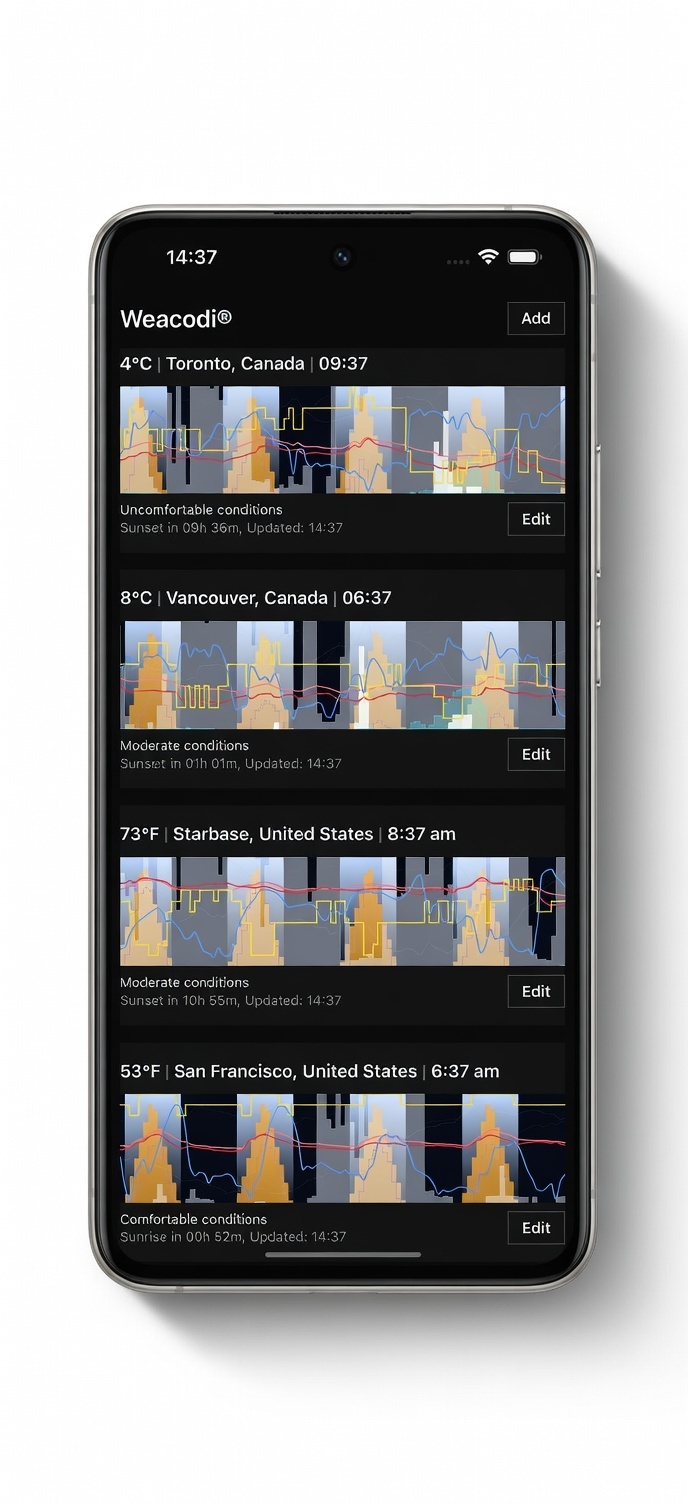
Try the dashboard version: build your own list of Weacodi panels with saved locations and settings.
Open Dashboard
See It In Action
Watch a quick walkthrough demonstrating how to explore the Weacodi dashboard, add panels, and read the Weather Comfort Diagram live.
Weacodi Forecast Demo
Live Weacodi forecast below. It uses your browser location; if blocked, it defaults to Munich. Adjust the inputs and refresh to see how the chart reacts.
Pick a location or let geolocation set it, then hit Update to reload the Grafana panel.
Weather Comfort Diagram™
Short name: Weacodi, phonetic transcription: /wiːˈækədi/.
Ease of Perception: The main goal of the diagram is to provide the user with weather information without the need to read numerical values, which significantly simplifies decision-making regarding training or trips.
Combination of Graphs: The diagram consists of a set of combined graphs, which allows integrating various weather data into a single image, making it easier for the user to perceive.
Absence of Numerical Values: The diagram does not use numerical values, making it intuitive and accessible for users without specialized training.
Relative Values: The values on the Y-axis are relative and help the user quickly understand how comfortable or dangerous the weather conditions are without delving into details. The diagram consists of a set of combined graphs that display various weather parameters throughout the day. The Y-axis of the diagram reflects relative values answering the question, "How much? Is it maximally possible or not at all?" This allows visualizing different aspects of the weather without the need for specific numerical values. The X-axis of the diagram reflects time.
Visual Representation of Weather Conditions: The diagram displays various weather parameters, including sky, sun, cloudiness, rain, snow, as well as the calculated comfort level, providing the user with a comprehensive view of the weather conditions.
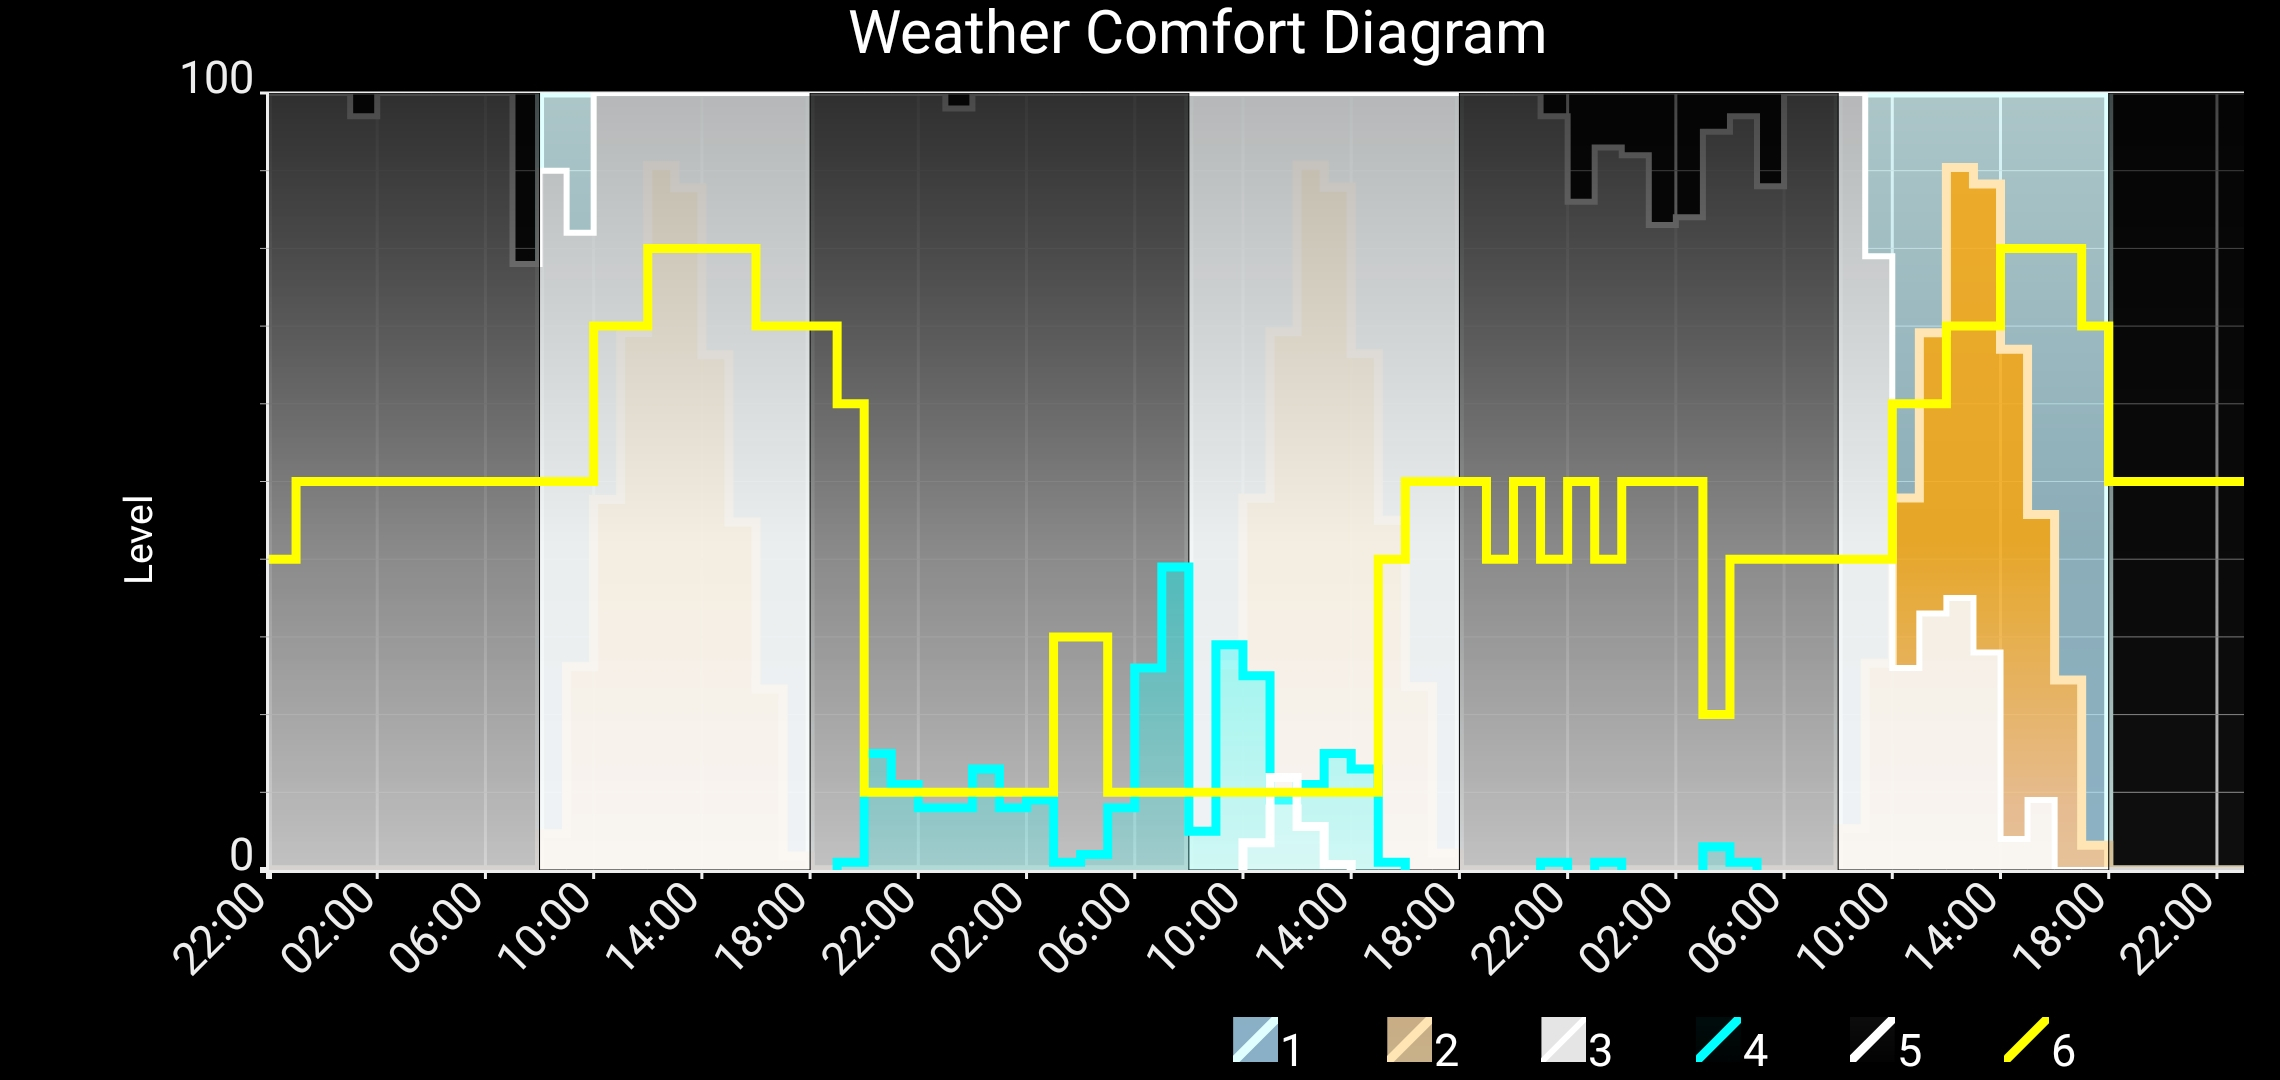
The diagram displays the following data (see picture):
- Day – displayed depending on the time of day (1).
- Night – displayed depending on the time of day (black color area).
- Sun – the amount of sunlight, taking the time of day into account (2).
- Clouds – shows the presence and density of clouds, from a few clouds to a complete overcast (3).
- Rain – displays the presence of precipitation, including the probability and intensity of rain (4).
- Snow – displays the presence of snow, including the probability and intensity of snowfalls (5).
- Calculated comfort level (optional) – determined based on weather conditions, taking into account the time of year, showing comfort for cycling and training depending on the current conditions (6).
- Other relative values, for example, wind speed, where the maximum value "very windy" and minimum value "no wind at all" are relative and depend on the current application requirements.
Particular attention should be given to the line on the graph representing the "comfort level." This parameter is calculated using a unique algorithm that takes into account all weather data, including the sun, cloudiness, rain, and snow, as well as seasonal changes. The maximum comfort level means "very comfortable," the minimum means "absolutely uncomfortable, dangerous," and the average means "normal comfort level."
With this diagram, the user can instantly get an answer to the question: "Is the weather comfortable?" without the need to read numerical values. This simplifies the decision-making process of whether it’s worth going for a walk, training session or a ride.
Weacodi example
We can see that it's currently night. Tomorrow will be a good day, though there will be no sunshine. Rain is expected overnight and will continue into the morning. The following day will bring both rain and snow. However, after that, a beautiful sunny day will follow.
Cycling Weather Android application
Below is an example of how Weacodi is embedded as a widget inside the Cycling Weather application.
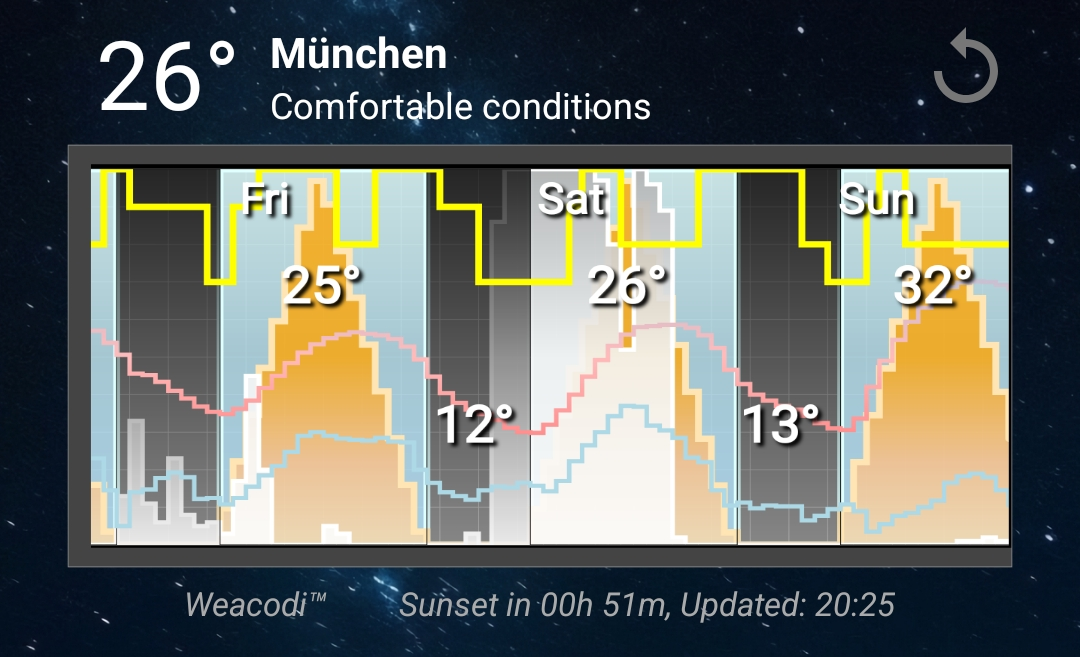
Screenshot from the Cycling Weather app.
Learn more & downloadWeacodi mobile applications


Weacodi Grafana Plugin
Datasource + panel for Grafana.

Code licensed under AGPL‑3.0; the Weather Comfort Diagram™ concept remains under CC BY-SA 4.0.
Weacodi Device Prototypes
Early mockups showing how Weacodi could appear across everyday devices.
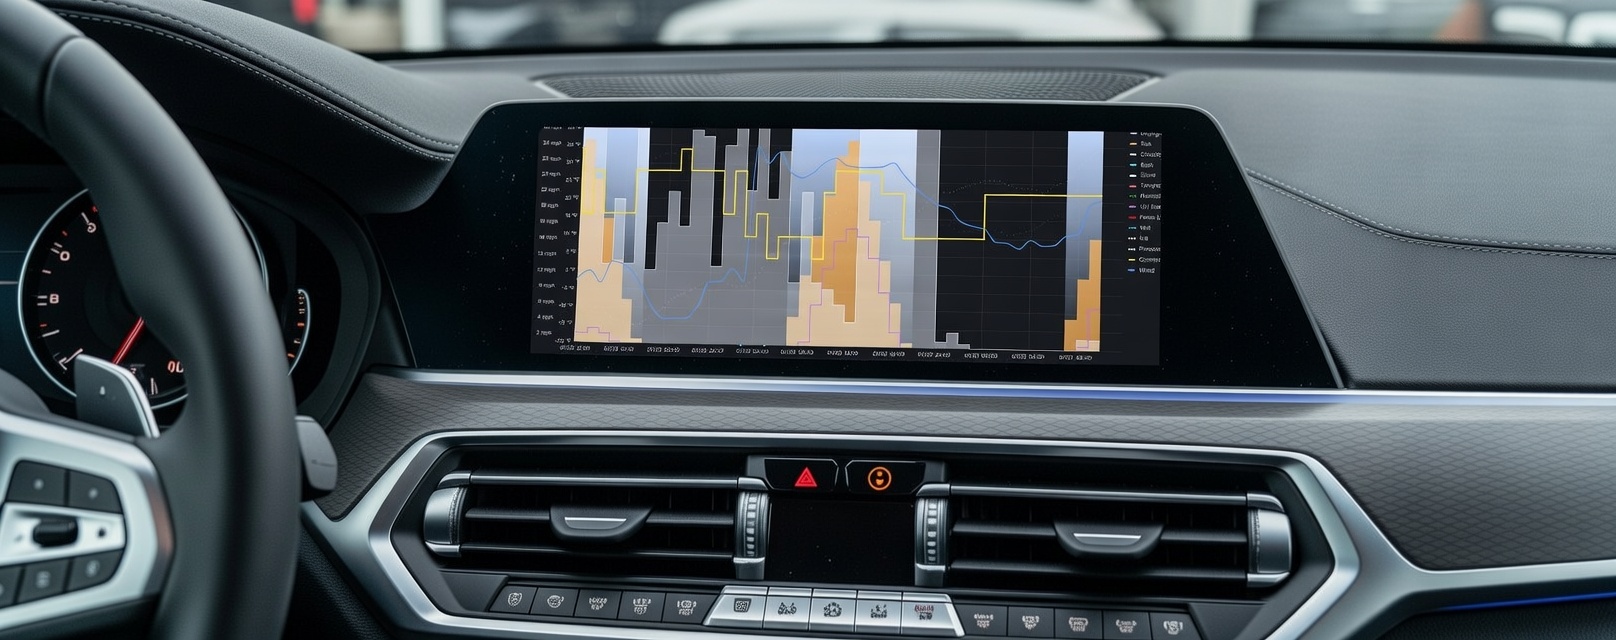
Car dashboard preview

Elevator display preview
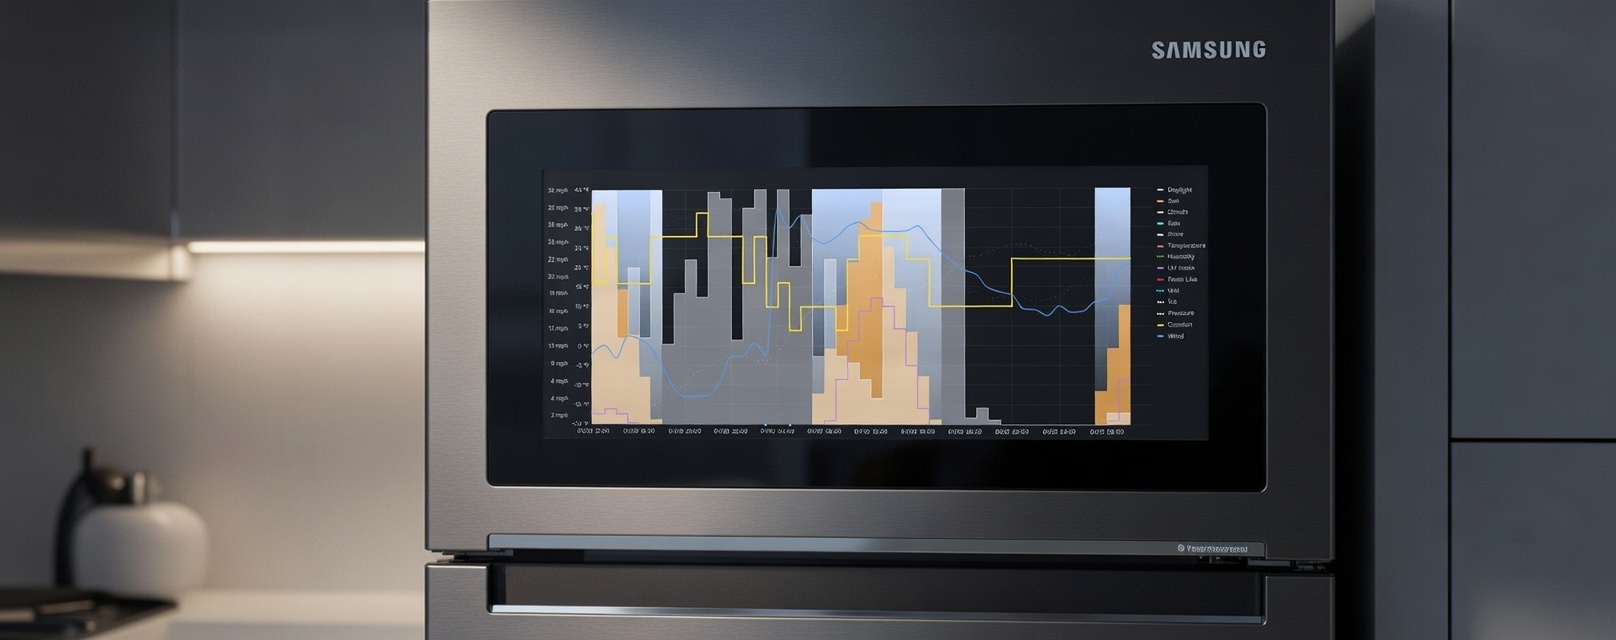
Smart fridge screen
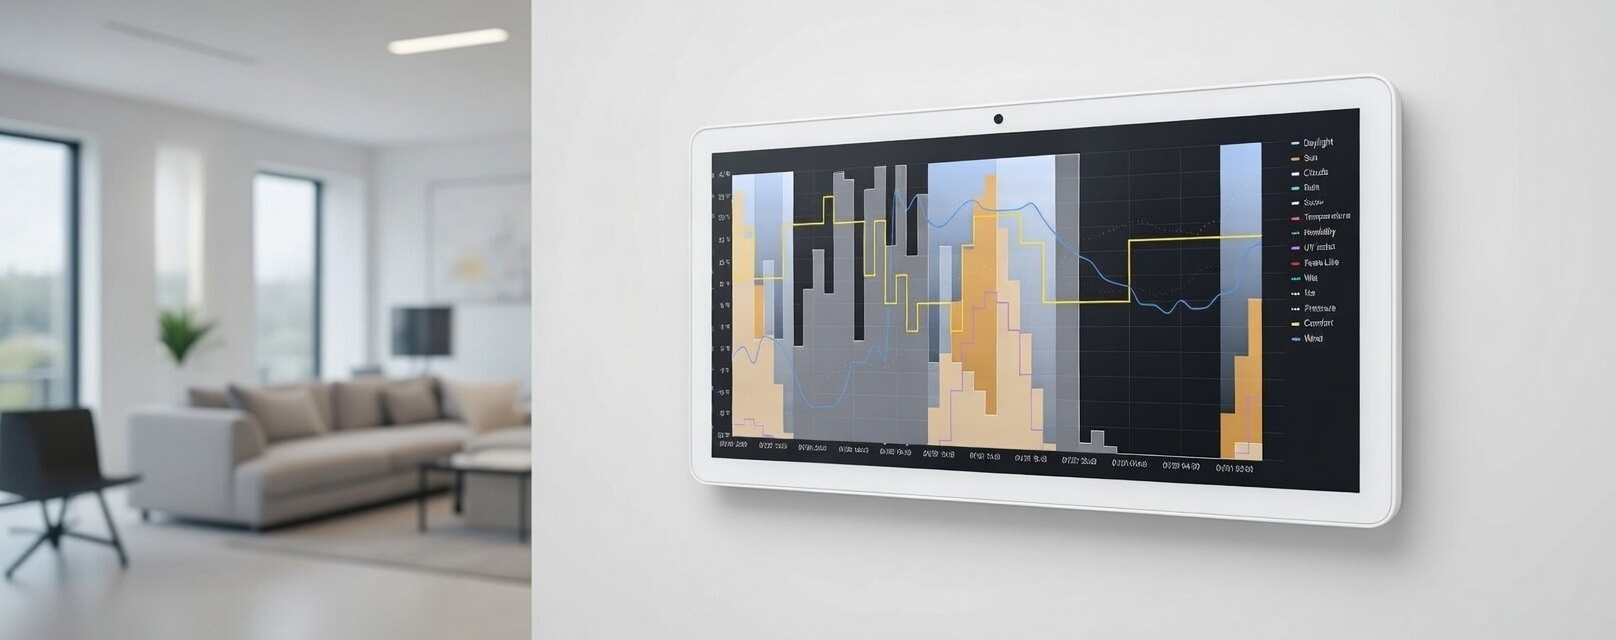
Home display preview
Office display preview
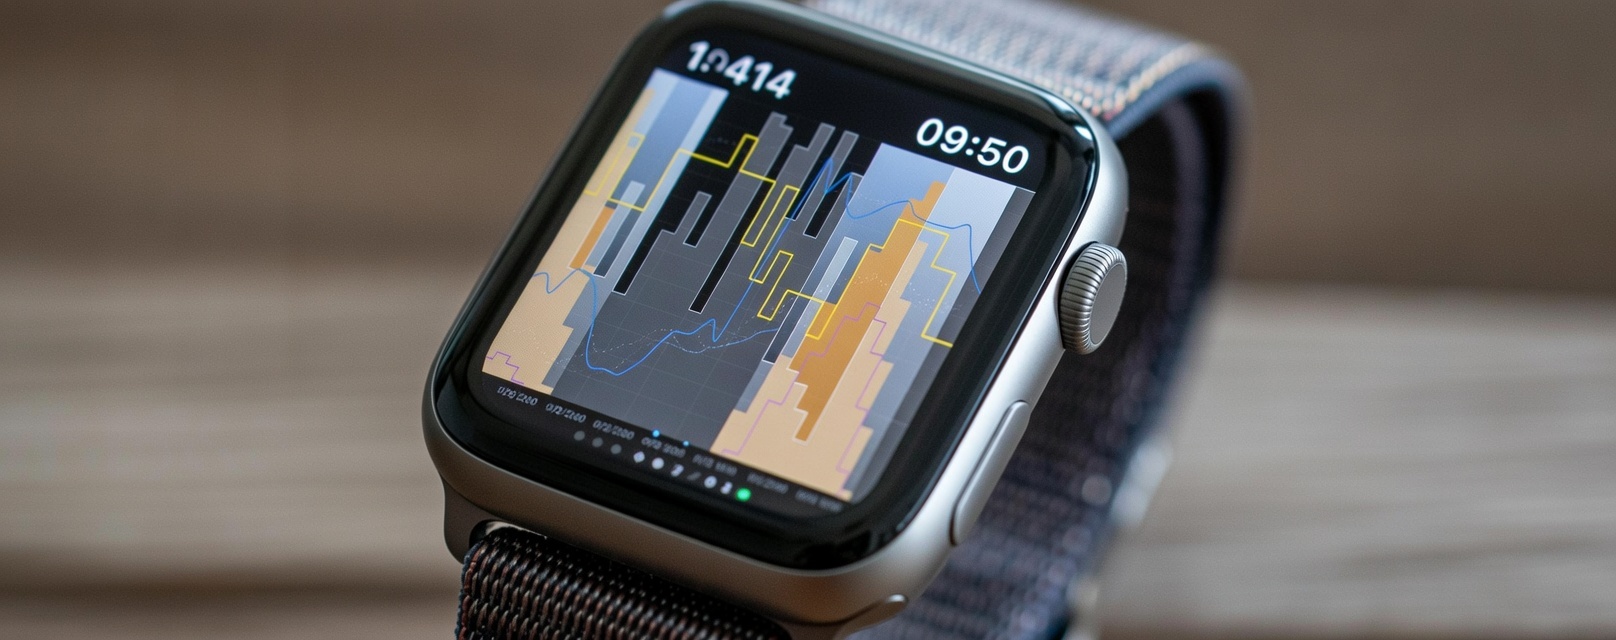
Wearable watch preview

Bathroom display preview

AI personalized forecast
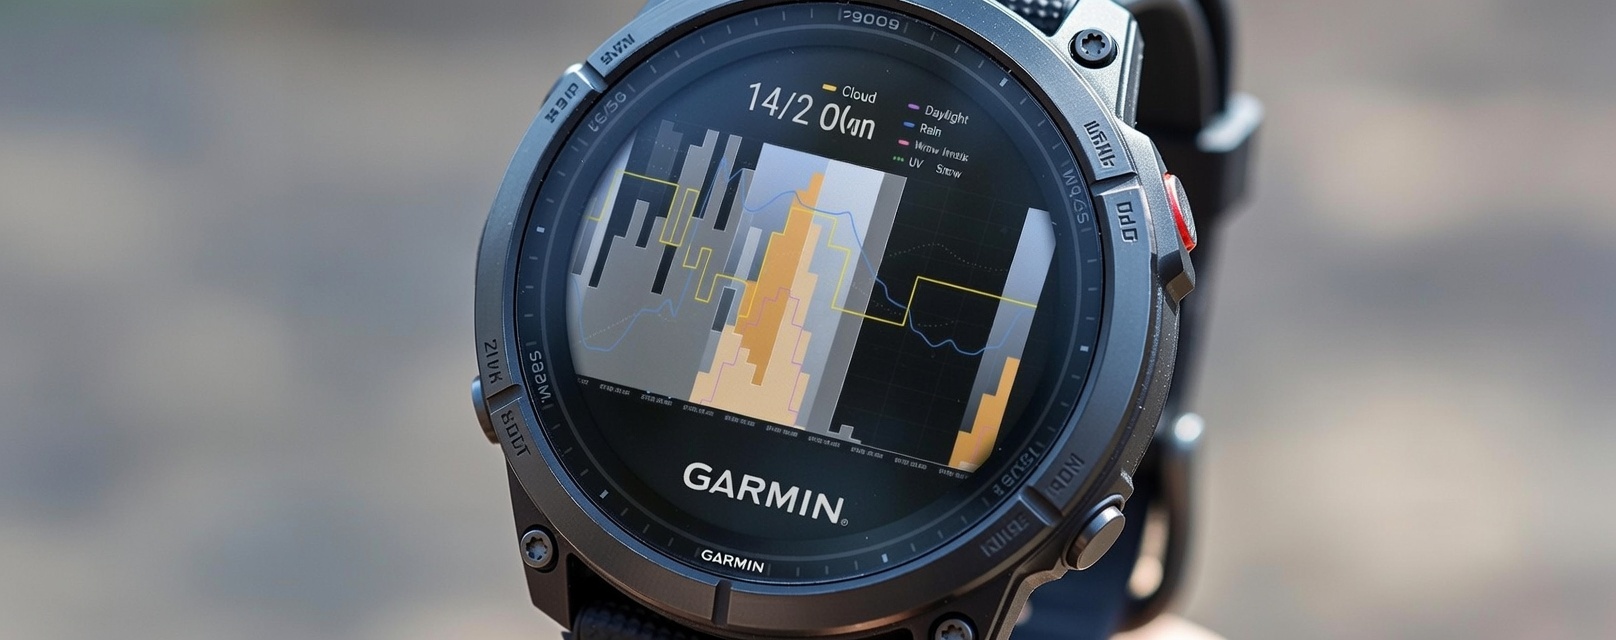
Garmin watch preview
Documentation
The guide shows how to build and embed the Weather Comfort Diagram™ consistently in apps, dashboards, and print.
- Layout: time axis, relative scale, day/night bands, comfort level, core layers.
- Elements: sun/cloud, rain/snow, comfort line, other optional parameters.
- Styling: palette, typography, spacing, and general readability guidance.
- Usage examples: widget, wearable, and dashboard layouts.
- License reminders: how to attribute and keep derivatives under ShareAlike.
Download: weacodi-concept.pdf
License
Weacodi (Weather Comfort Diagram™) is released under the Creative Commons Attribution-ShareAlike 4.0 International (CC BY-SA 4.0) license.
In practice, this means:
- Use it: You may embed the diagram in dashboards, widgets, wearables, or any other project, whether commercial or personal.
- Credit it: You must provide attribution by linking to https://weacodi.com and by referring to the work as “Weather Comfort Diagram™” or “Weacodi®”, including the author names.
- Share alike: Adaptations of the content must be published under the CC BY-SA 4.0 license.
- Source code: Any implementation source code should be released under a copyleft license (such as AGPL-3.0), so that all improvements remain open.
Authors & contact
Authors:
Oleksii Zubovskyi
Olena Zubovska
Email:
weacodi@gmail.com
zubovsky@gmail.com
Website:
https://weacodi.com
LinkedIn:
Oleksii Zubovskyi
Citation
Zubovskyi, O., & Zubovska, O. (2025). Weacodi - One Second Forecast: An alternative way to visualize the weather forecast — helping to assess atmospheric conditions in just one second. weacodi.com. https://doi.org/10.5281/zenodo.18916318
Trademark notice
Weacodi® and any stylized variants are registered trademarks of the project authors, Oleksii Zubovskyi and Olena Zubovska.
You may use the name descriptively when referring to the project or the diagram, but you may not use it as part of a product name, logo, or domain name without explicit permission.
Questions? Email weacodi@gmail.com.